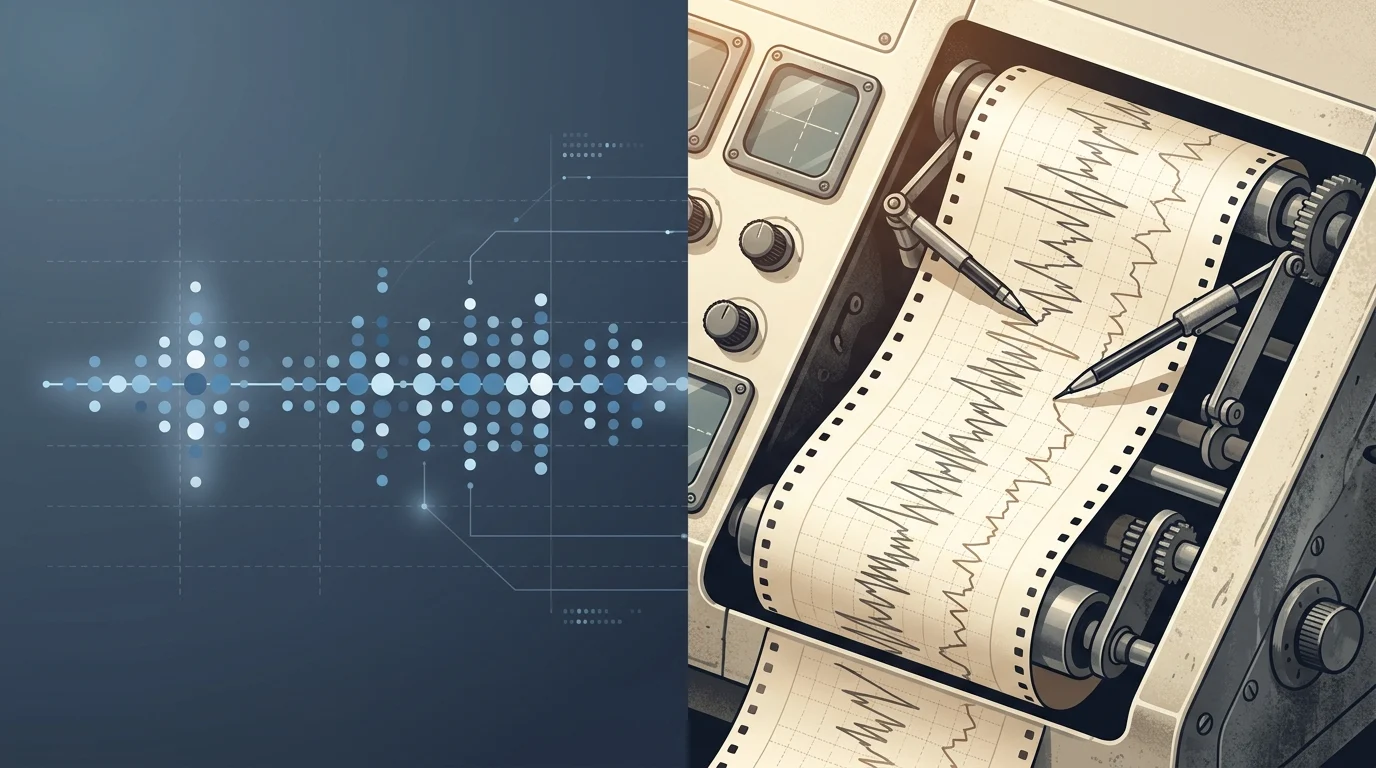
Quick Answer: The strip chart meaning depends entirely on context, yet unlike many technical terms, this phrase carries two remarkably distinct definitions across statistics and engineering. It can point to a simple one-dimensional scatter plot or a continuous paper recording of physical signals. This guide breaks down every major meaning so you can decode the term no matter where you encounter it.
Understanding technical vocabulary has become a daily necessity for anyone navigating data analysis or industrial monitoring. New tools appear every week; consequently, older terms accumulate fresh relevance as they spread across disciplines. Strip chart is a perfect example of this evolution. It started as a paper-based recording method, expanded into statistical visualization, and now functions as both a software command and a hardware description. Some usages are analytical. Some are mechanical. One is purely digital. Knowing which one applies can save you from an awkward misunderstanding.
The Core Strip Chart Meanings
In everyday technical conversation, strip chart most often carries one of two meanings. The first is statistical and visual. The second is industrial and physical.
The most widespread modern definition is a one-dimensional scatter plot used to display data points along a single axis . This phrase captures a state of simplified visualization. You are not merely plotting numbers. You are completely arranging individual values to reveal clusters, gaps, and outliers. People use it in data analysis, research, and statistical software. The term says more than “dot plot” sometimes could.
A traditional engineering definition is a continuous paper record of one or more variables over time . This version expresses a physical tracing, often produced by a pen moving across a roll of paper. If someone mentions a strip chart recorder in a laboratory or factory, they mean the machine that produces these traces. The humor comes from how tangible it sounds. One phrase replaces an entire apparatus description.
Both usages share a common thread. They describe a visual representation. One is representation for analysis. The other is representation for monitoring.
Strip Chart in Statistics and Data Analysis
Strip chart takes on a precise life in statistical contexts. There, it refers to a simple yet powerful tool for examining distributions.
A strip chart plots sorted response values along one axis, with all values set to the same vertical position . This arrangement reveals the shape of a dataset without the clutter of a histogram. You can spot clusters, gaps, and outliers at a glance. The approach works best with small to moderate sample sizes, where individual points remain distinguishable.
In the R programming language, this visualization appears as both stripchart and ggstripchart . Analysts use it to compare groups, add summary statistics, or overlay box plots. The tool handles repeated values through jittering or stacking, preventing points from obscuring each other . This flexibility makes it valuable for exploratory data analysis.
A subtle distinction separates strip charts from dot plots in some software. The EPFL documentation notes that while the terms overlap, strip charts typically plot individual data points along a single axis, whereas dot plots may group values into bins . Both serve similar purposes, yet the terminology varies by discipline and tool.
Strip Chart in Engineering and Medicine
Strip chart takes on a mechanical life in industrial and medical settings. There, it describes a recorder that traces signals onto moving paper.
A strip chart recorder passes a roll or strip of paper beneath one or more pens . As the input signal changes, the pens deflect, producing a continuous graph. Engineers use these devices to monitor temperature, pressure, flow rates, and electrical signals in real time. The paper record provides a permanent archive that can be torn off and stored.
In medicine, strip chart recorders have monitored heart rate, respiration, and other vital signs . The traces allow clinicians to review trends, detect irregularities, and compare current readings against historical baselines. Modern digital monitors have largely replaced paper systems, yet the terminology persists in descriptions of physiological waveform displays.
The engineering version carries practical weight. A strip chart recorder in a factory or hospital represents a real instrument with calibration needs, paper supplies, and maintenance schedules. Treating it as mere slang in professional settings would be dismissive of operational realities.
How to Tell Which Strip Chart Meaning Is Being Used
Context is everything with this phrase. The setting and vocabulary reveal the intended meaning before the words do.
If the discussion involves statistics, R programming, or data visualization, the plotting meaning is likely. References to stripchart commands, jitter options, or data distributions point to the statistical definition . These conversations appear in research forums, analytics tutorials, and software documentation.
When strip chart appears alongside recorders, pens, or paper rolls, the engineering meaning usually applies. Mentions of chart speed, thermal writing, or signal traces clearly point to the physical device .
A medical context that references vital signs or patient monitoring likely uses the recorder meaning. The placement within clinical documentation or equipment descriptions is the giveaway.
If the message sounds computational and appears in a coding environment, the plotting meaning becomes possible. This usage often follows a request to visualize data.
When Not to Use Strip Chart Casually
Strip chart does not belong in every conversation. Its engineering meaning carries practical weight and expresses operational reality. Using it loosely in industrial or medical discussions can come across as dismissive of real equipment.
There is also a statistical precision to consider. A strip chart is a specific visualization, not a generic graph. Treating it as a synonym for any chart can seem inaccurate.
Other contexts use the phrase differently. In patent literature, strip chart appears in descriptions of recording mechanisms and signal processing . In software documentation, it names a specific function. Each field has its own conventions, and casual usage rarely crosses into these spaces.
The safest approach is to match the register of the conversation. Technical terms belong in technical discussions. When in doubt, clarity beats casualness.
Strip Chart vs Similar Terms
Several other terms overlap with strip chart in meaning. Understanding the differences helps avoid confusion.
Dot plot is often used interchangeably with strip chart in statistics. Some software distinguishes them by how repeated values appear, yet the core idea remains the same .
Histogram groups values into bins, showing frequency rather than individual points. Strip charts preserve each data point, making them better for small samples .
Chart recorder is the broader category that includes strip chart recorders. A chart recorder may use circular paper or other formats. Strip chart specifically uses a linear roll .
Scatter plot displays two variables against each other. A strip chart uses only one variable, arranging points along a single axis.
Why Strip Chart Endures as a Term
The phrase strip chart endures because it attaches to fundamental practices. Statistical visualization remains essential for understanding data. Physical recording, while increasingly digital, still shapes how we think about monitoring signals over time.
The statistical version has grown as data tools become more accessible. The engineering version persists in legacy systems and in the language of waveform displays. Together, they show how a single phrase can serve both analysis and observation.
Regional and Platform Variations
Strip chart does not mean the same thing everywhere. Discipline and context shape how the term is used.
In academic statistics, the plotting meaning dominates. Textbooks and software manuals treat strip charts as basic exploratory tools.
In industrial engineering, the recorder meaning dominates. Factories and laboratories still use paper-based systems for compliance and archiving.
In medical settings, strip chart appears in descriptions of legacy monitoring equipment and in references to waveform traces.
In R programming communities, stripchart is a specific function with documented parameters and examples .
FAQs
What does strip chart mean?
Strip chart most commonly means a one-dimensional scatter plot in statistics or a paper-based signal recorder in engineering.
Is strip chart a bad word?
No, strip chart is a neutral technical term with no profane connotations.
What does strip chart mean in statistics?
In statistics, a strip chart plots individual data points along a single axis to reveal distributions.
What does strip chart mean in engineering?
In engineering, a strip chart is a continuous paper record of variables like temperature or pressure over time.
Can strip chart mean something medical?
Yes, strip chart recorders have monitored vital signs like heart rate and respiration.
What is the difference between strip chart and histogram?
Strip charts show individual points, while histograms group values into bins.
Does strip chart have a programming meaning?
Yes, stripchart is a function in R for creating one-dimensional scatter plots.
Is strip chart safe to use in professional settings?
Yes, strip chart is appropriate in statistical, engineering, and medical contexts.
Why do people say strip chart on TikTok?
On TikTok, strip chart appears in educational content about data visualization or vintage technology.
How do I know which strip chart meaning is being used?
Look at the platform, the vocabulary, and the surrounding tools to determine the intended meaning.
Conclusion
The strip chart meaning shifts with every context. In a statistics tutorial, it means a one-dimensional scatter plot. In case of a factory, it means a paper trace of pressure or temperature. If it is a hospital, it means a record of heart rate and in R code, it means a function call. The only way to know which meaning applies is to read the setting, the tools, and the relationship between the people involved. When in doubt, a simple question clears up any confusion faster than guessing.
Technology evolves quickly, and strip chart may take on new shades of meaning in the coming years. For now, these definitions cover almost every situation you will encounter. Learn them once, and you will never be lost when this phrase appears in your feed.